论文原文与图表
A Load Distribution Estimation Method for Multiple Trucks Incorporating Attention Mechanism
融合注意力机制的多卡车载荷分布估计方法
本文在Mask R-CNN中加入注意力模块和Mass Head,从统一监控图像中检测多个料斗、分割物料区域,并估计每个料斗四个位置的载荷分布。
论文摘要
工程车辆载荷分布信息可用于装载状态评估与调度。论文提出MM R-CNN,在Mask R-CNN基础上增加由注意力模块和Mass Head组成的Mass Module。通道注意力、多尺度空间注意力与融合结构用于提取车辆和物料特征,Mass Head结合注意力特征和材料掩膜回归四个位置的质量系数。实验使用自建数据集,比较了注意力结构、材料掩膜、骨干网络、多目标任务及模拟粉尘条件下的结果。
- Attention fusion architecture
- Incomplete target prediction
- Load distribution estimation
- Multitruck estimation
MM R-CNN的检测、分割与载荷回归链路
MM R-CNN沿用Backbone、FPN、RPN、RoIAlign、Box Head和Mask Head,并增加Mass Module。Box Head输出料斗与物料候选框,Mask Head生成材料掩膜,Mass Module输出每个料斗四个位置的归一化质量系数。
多目标样本中,RoIAlign提供的正样本框经过二次筛选。筛选依据包括类别一致、与真实框的最大IoU以及料斗框与材料框数量一致,使料斗特征与对应材料掩膜保持匹配。
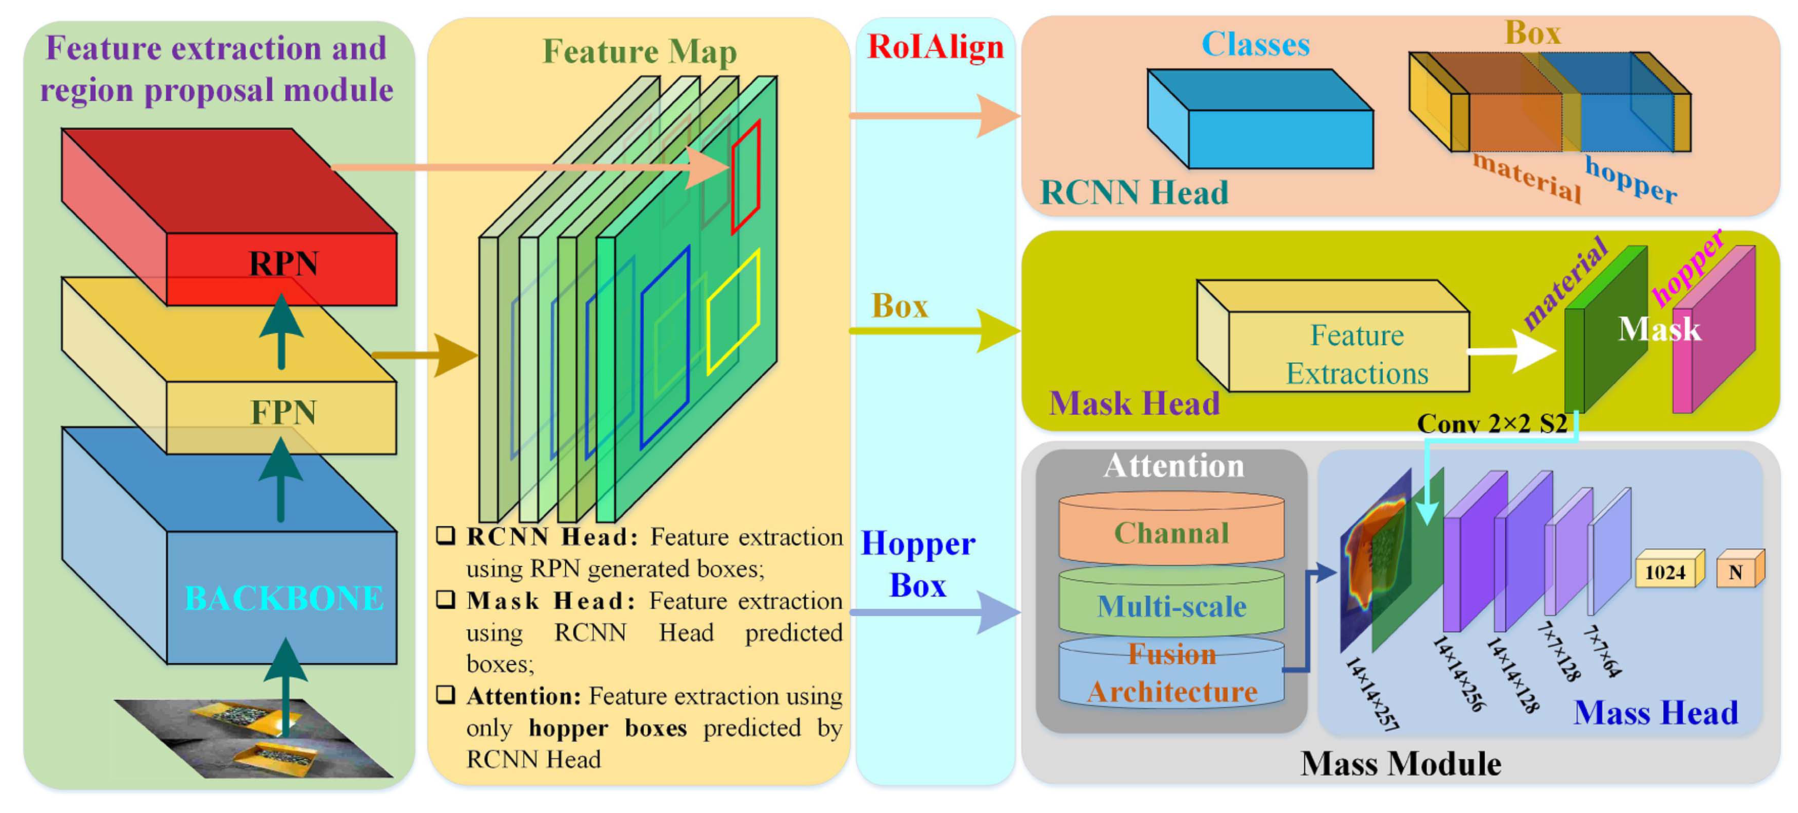
Mask Mass R-CNN总体架构:该网络在Mask R-CNN中增加由注意力模块和Mass Head组成的Mass Module。注意力模块包括通道注意力、多尺度空间注意力和注意力融合;Mass Head将注意力输出特征与材料掩膜作为输入,回归物料载荷分布,本文N=4。
Presents an overview of the Mask Mass R-CNN architecture, which extends the Mask R-CNN by adding a Mass Module, consisting of two main components: An attention module and a Mass Head. The attention module is composed of three parts: 1) channel attention; 2) multiscale spatial attention; and 3) attention fusion. The Mass Head takes the feature maps output by the attention module along with the Materials Mask as inputs to regress the load distribution of the materials, where N = 4 in this article.
查看高清原图 ↗通道注意力、多尺度空间注意力与融合结构
通道注意力使用预测料斗框提取特征A,通过1×1卷积构造焦点中心并计算通道关系,得到输出特征K。多尺度空间注意力对特征A进行最大池化和平均池化,并使用1、3、5、7尺度卷积核提取不同感受野的空间信息,得到特征E。
融合结构拼接K和E并进行卷积,再结合原始特征A形成输出R。Fig.2分别给出通道注意力、多尺度空间注意力和融合结构。
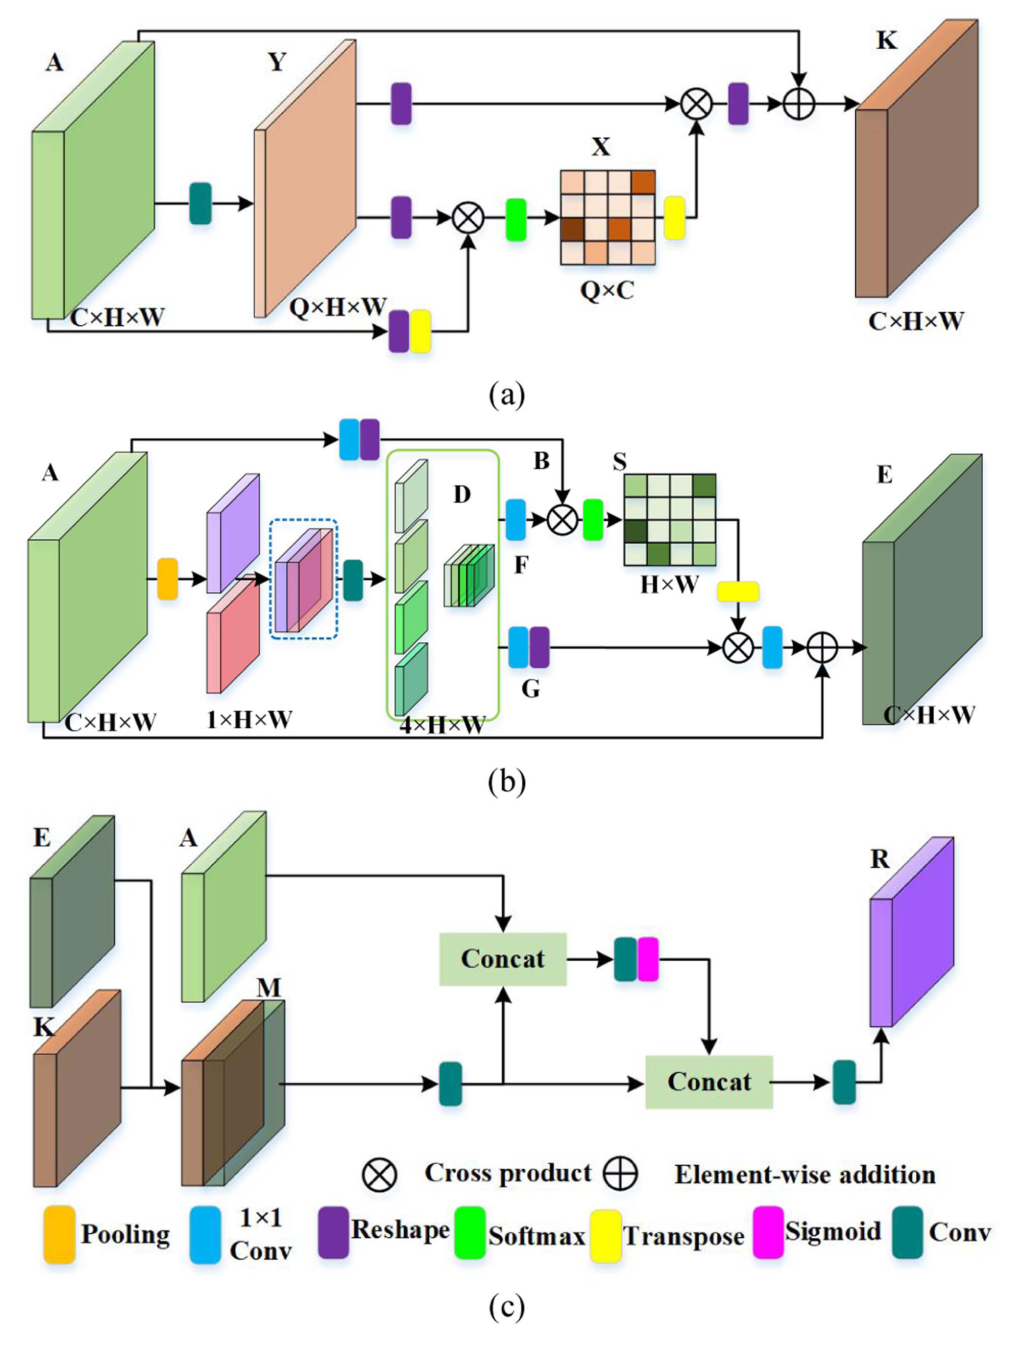
注意力模块包括:(a)通道注意力,(b)多尺度空间注意力,(c)注意力融合结构。A表示基于预测料斗框提取的输出特征图,K为紧凑通道注意力输出,E为多尺度空间注意力输出,R为融合结构处理后的最终输出。
Illustrates the attention module, which includes (a) channel attention, (b) multiscale spatial attention, and (c) the attention fusion architecture. A represents the output feature map extracted based on the predicted hopper boxes. K is the output of the compact channel attention, E is the output of the multiscale spatial attention, and R is the final output after being processed by the fusion architecture.
查看高清原图 ↗材料掩膜与四位置质量系数
Mass Head将注意力模块输出R与材料掩膜拼接,通过卷积和全连接层回归m1、m2、m3、m4四个位置的质量系数。四个输出均约束在0到1之间。
训练使用Balanced L1形式的回归损失。多目标训练从RoIAlign的512个正样本框中筛选与目标对应的料斗框和材料框,随后分别形成每个目标的载荷分布输出。
两种料斗、两类材料与九个采集视角
自建数据集包含28640张图像,每张图像具有对应的四位置载荷分布文件,其中8320张图像具有语义掩膜。实验搭建两种料斗模型,使用矿石和橡胶两类材料,并在料斗底部布置四个压力传感器获取载荷标签。
图像从车辆周围八个视角和顶部视角采集,数据包括目标信息完整、车辆局部缺失和物料信息缺失场景。Fig.3展示料斗模型、卸料区域、压力传感器、相机、铲斗与实验材料。
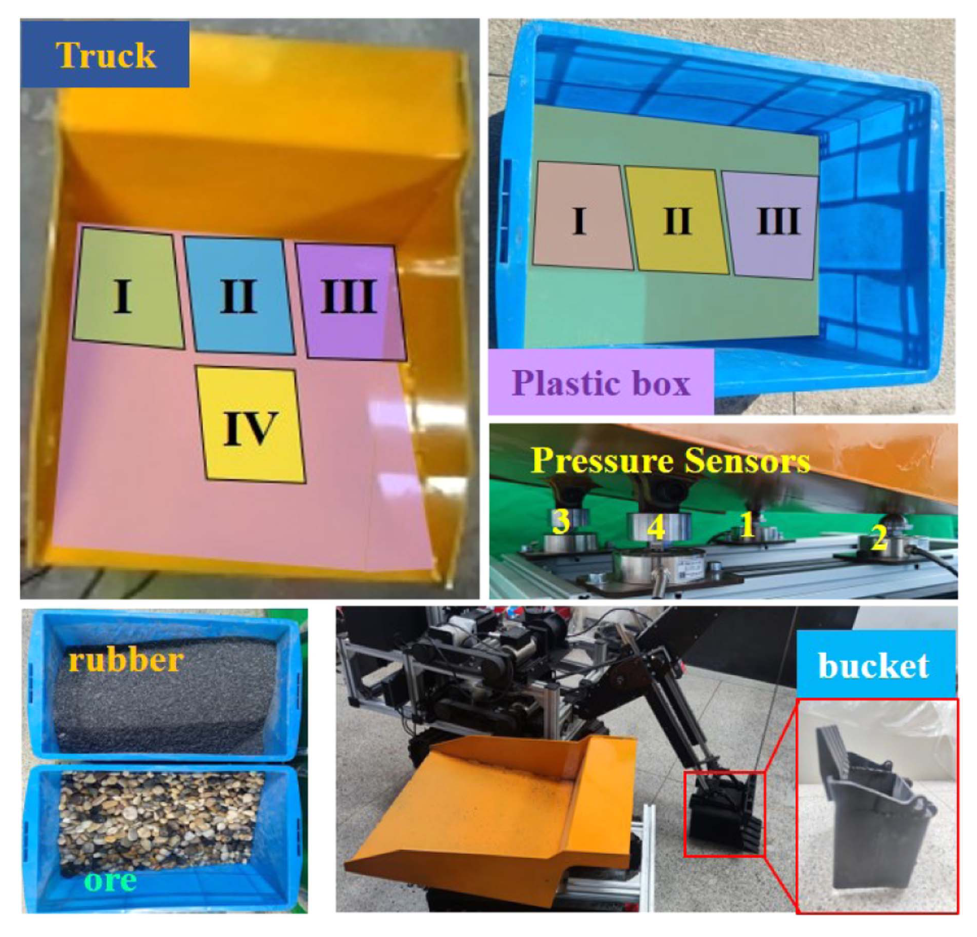
载荷分布数据集实验装置:包括两种不同的料斗模型及各类料斗的卸料位置;实验材料包括矿石和橡胶。
Load distribution dataset experimental setup: This includes two different models of hoppers and the unloading positions for each type of hopper. Additionally, the materials used in this experiment consist of ore and rubber.
查看高清原图 ↗注意力融合和材料掩膜的增量结果
Table I中,Base预测准确率为86.68%,多尺度空间注意力结构为88.76%,通道—空间串联结构为91.27%,完整融合结构Base-AF为94.32%。Base-AF相对Base提高7.64个百分点,相对简单串联结构提高3.05个百分点。
Table III中,材料掩膜使Base由86.68%提高到87.12%,提高0.44个百分点;使Base-AF由94.32%提高到95.1%,提高0.78个百分点。
四位置相关性、误差分布与多目标结果
Fig.6中,四个位置预测值与真实值的Pearson相关系数为0.989–0.994,线性拟合斜率接近1。四个位置的百分比误差主要集中在±7%,同时存在少量误差较大的样本。
Table IV中,MM R-CNN多目标任务的预测准确率为95.1%,预测时间为63.2 ms。四种单目标料斗—材料组合的准确率为96.47%–97.87%,预测时间为55.4–56.3 ms。
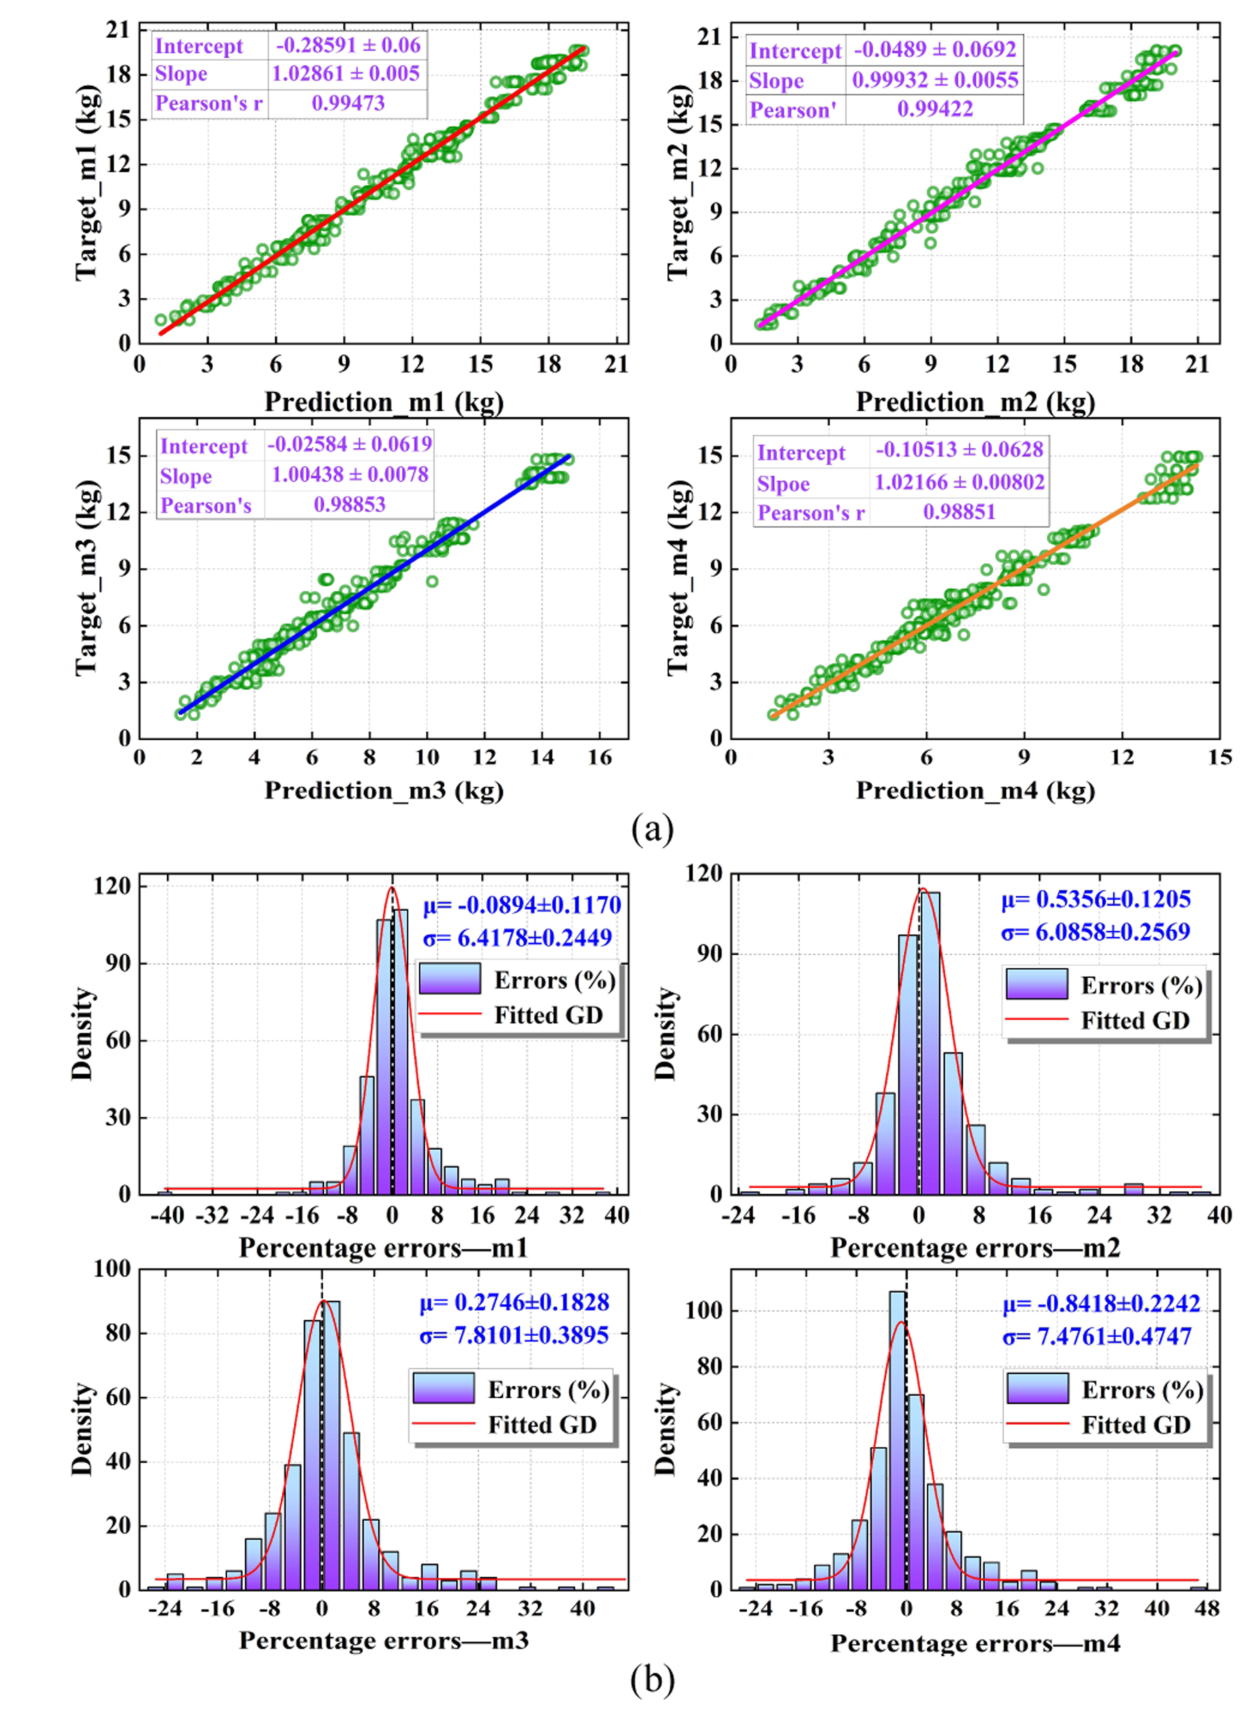
MM R-CNN在自建数据集上的预测结果分析:(a)四个位置的网络预测值与真实值线性拟合,并给出截距、斜率和Pearson相关系数;(b)四个位置的预测百分比误差,其分布近似符合高斯分布,其中μ表示均值,σ表示方差。
Analysis of the prediction results of MM R-CNN on the self-built dataset. (a) Linear fitting of the network’s predicted values and the true values at four positions, showing the intercept, slope, and Pearson correlation coefficient. (b) Percentage of prediction errors at the four positions, with a distribution approximately conforming to a Gaussian distribution, where μ represents the mean and σ represents the variance.
查看高清原图 ↗模拟粉尘退化和四目标拼接测试
Fig.7(a)使用大气散射模型模拟粉尘。在L=0.75时,轻度粉尘参数λ=0.04对应90.1%的预测准确率;重度粉尘参数λ=0.08时下降到51.6%。
Fig.7(b)将四张单目标图像拼接为四目标输入,结果范围为89.1%–95.8%,四个目标的准确率分别为91.3%、90.3%、89.1%和95.8%。多目标条件下各目标结果低于对应单目标结果。
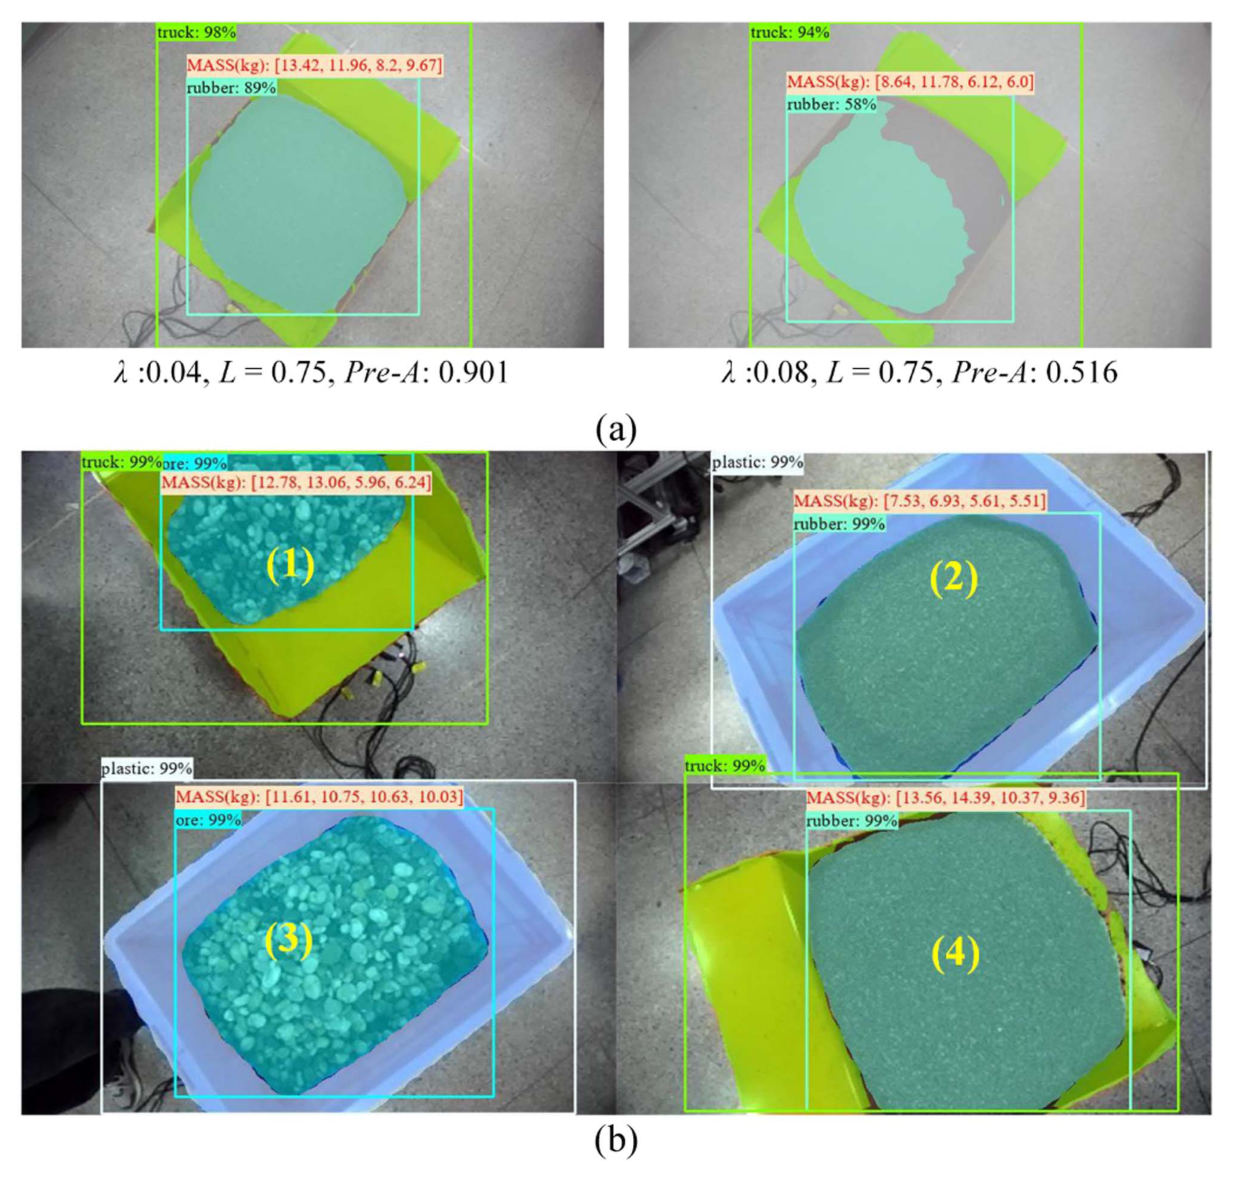
粉尘条件和四目标检测结果可视化:(a)不同模拟粉尘条件下的预测性能;当大气光L=0.75时,轻度粉尘λ=0.04的准确率为0.901,重度粉尘λ=0.08时下降到0.516,正常条件见Fig.5第一行。(b)四个目标的预测结果和准确率分别为0.913、0.903、0.891和0.958;对应单目标条件准确率为0.970、0.971、0.939和0.983。
Visualization of detection results under dusty conditions and for four targets. (a) Predictive performance under simulated different dust conditions. With atmospheric light L = 0.75, the accuracy under mild dust conditions (λ = 0.04) is 0.901, while under severe dust conditions (λ = 0.08), the accuracy drops to 0.516, with normal conditions represented in the first row of Fig. 5. (b) Prediction results and accuracy for four targets, which are 0.913 (1), 0.903 (2), 0.891 (3), and 0.958 (4). The prediction accuracies under single-target conditions are 0.97 (1), 0.971 (2), 0.939 (3), and 0.983 (4).
查看高清原图 ↗自建数据范围与工程应用条件
当前数据使用两种料斗模型和矿石、橡胶两类松散均质材料。自建实验条件与真实工程环境存在差异,混合或异质材料尚未纳入验证。
论文记录少量预测误差超过40%的样本,并提出多角度检测、合理范围校验与人工核验。粉尘、降雨、光照变化和相机运动模糊会影响图像质量,后续研究包括图像恢复、环境防护和复杂材料数据。
第二层阅读
需要更快地把握方法链和核心机制?
AI简报不会替代上方的论文原文导读;它只在您主动打开时加载。引用本文
以下格式根据论文正式题录生成;使用前请按目标期刊或机构规范复核。
WU G, LI X, BI Q, et al. A Load Distribution Estimation Method for Multiple Trucks Incorporating Attention Mechanism[J]. IEEE Transactions on Industrial Informatics, 2025, 21(4): 3276-3285. DOI:10.1109/TII.2024.3523580.
Wu, G., Li, X., Bi, Q., Yao, Z., & Wang, Y. (2025). A load distribution estimation method for multiple trucks incorporating attention mechanism. IEEE Transactions on Industrial Informatics, 21(4), 3276–3285. https://doi.org/10.1109/TII.2024.3523580
G. Wu, X. Li, Q. Bi, Z. Yao, and Y. Wang, “A Load Distribution Estimation Method for Multiple Trucks Incorporating Attention Mechanism,” IEEE Transactions on Industrial Informatics, vol. 21, no. 4, pp. 3276–3285, Apr. 2025, doi: 10.1109/TII.2024.3523580.